# GeoJSON 图层
mapgis-3d-geojson-layer
# 属性
# vueKey
- 类型:
String - 可选
- 非侦听属性
- 默认值:
default - 描述:
mapgis-web-scene 组件的 ID,当使用多个 mapgis-web-scene 组件时,需要指定该值,来唯一标识 mapgis-web-scene 组件,
同时 mapgis-web-scene 插槽中的组件也需要传入相同的 vueKey,让组件知道应该作用于哪一个 mapgis-web-scene。
# vueIndex
- 类型:
Number - 可选
- 非侦听属性
- 描述:
当 mapgis-web-scene 插槽中使用了多个相同组件时,例如多个 mapgis-3d-igs-doc-layer 组件,用来区分组件的标识符。
# baseUrl
- 类型:
Object | String - 非侦听属性 必传项
- 描述: GeoJSON 数据的 url
# layerId
- 类型:
String - 非侦听属性 必传项
- 描述: 图层的 id 值
# autoReset
- 类型:
Boolean - 可选
- 非侦听属性
- 默认值
true - 描述: 初始加载时,视角是否自动跳转到图层中心
# renderer
- 类型:
Object - 必选
- 非侦听属性
- 描述: 专题图渲染规则, 包含以下属性:
| Name | Type | Description |
|---|---|---|
| type | String | 专题图类型,可选 "simple、unique-value、class-breaks" |
| field | String | 专题图字段名称,用来确定单值或分段要素,仅在renderer.type="unique-value、class-breaks"时使用 |
| legendOptions | Object | 专题图图例选项,用来在图例中展示符号所表达的信息,如专题图标题 |
| symbol | Object | 统一专题图符号样式 |
| label | String | 统一专题图标签 |
| defaultSymbol | Object | 单值分段专题图默认符号样式,用来绘制具有与给定中断值不匹配的要素 |
| defaultLabel | String | 单值、分段专题图默认标签,用来描述分配了默认符号的元素 |
| uniqueValueInfos | Array | 专题图单值信息,仅在renderer.type="unique-value"时使用 |
| classBreakInfos | Array | 专题图分段信息,仅在renderer.type="class-breaks"时使用 |
| normalizationType | String | 专题图归一化类型,仅在render.type="class-breaks"时使用,可选 "field、"percent-of-total" |
| normalizationField | String | 专题图根据字段归一化,即分段字段属性值 / 归一化字段属性值,如果renderer中定义了normalizationField,则优先执行normalizationField按字段归一化,通过归一化出的结果和分段专题图停靠点的值进行比较,若仅定义normalizationType未定义normalizationField,则不进行归一化,使用场景:如 区域人口数 / 该区域面积,返回该区域人口密度,根据人口密度绘制分段专题图 |
| normalizationTotal | Number | 专题图根据属性值总和归一化,即分段字段属性值 / 给定总和,如果renderer中定义了normalizationTotal,则优先执行normalizationTotal按字段值总和归一化,通过归一化出的结果和分段专题图停靠点的值进行比较,若仅定义normalizationType未定义normalizationTotal,则使用 分段字段属性值 / 分段字段属性值总和 进行归一化,使用场景:如 区域GDP总量 / 所有区域GDP总量和,返回该区域GDP占比,根据GDP占比绘制分段专题图 |
| valueExpression | String | 专题图计算表达式,用来对要素中的单/多个属性进行数学计算,属性字段使用"$feature.field"表示,如"[($feature.lg + 2) * 10 - 20 / 2] / 5 + $feature.mpLayer",如果renderer中定义了valueExpression,则优先执行valueExpression表达式,通过表达式计算出来的结果和单值/分段专题图停靠点的值进行比较 |
| valueExpressionTitle | String | 专题图计算表达式标题 |
| visualVariables | Array | 专题图视觉变量 |
其中 symbol 对象中包括以下属性:
| Name | Type | Description |
|---|---|---|
| type | String | 专题图符号样式类型,可选 "point-3d、line-3d、polygon-3d" |
| symbolLayers | Number | 专题图符号图层,可选 "icon、line、fill、extrude" |
symbolLayers 对象中包括以下属性:
| Name | Type | Description |
|---|---|---|
| type | String | 专题图符号图层类型,可选 "icon、line、fill、extrude" |
| material | Object | 专题图要素样式 |
| material.color | String | 专题图要素颜色 |
| outline | Object | 专题图要素边线样式,当传入边线颜色或边线宽度参数时启用边线 |
| outline.color | String | 专题图要素边线颜色,仅当 type="icon 或 fill"时生效 |
| outline.width | Number | 专题图要素边线宽度,仅当 type="fill"时生效 |
| resource | Object | 专题图要素绘制类型,未传入时默认绘制"circle"二维点 |
| resource.primitive | String | 专题图要素绘制类型,可选"circle、billboard" |
| resource.herf | String | 专题图要素图标符号,传入要素符号的url地址,支持"png、svg"类型 |
| resource.sizeInMeters | Boolean | 专题图要素图标符号尺寸单位(米),默认值false |
| resource.scale | Number | 专题图要素图标符号比例,仅当传入 resource.herf时生效,用于控制图标符号大小,默认值 1 |
| resource.distanceDisplayCondition | Array | 专题图要素符号可见性,仅当传入 resource.herf时生效,用于控制图标的最大最小可见高度, 默认值 [10, 100000] |
| size | Number | 符号尺寸,用于设置点要素大小和线要素宽度 |
uniqueValueInfos 对象中包括以下属性:
| Name | Type | Description |
|---|---|---|
| value | String、Number | 指定字段下的要素值,具有此值的要素将使用给定的符号可视化 |
| symbol | Object | 符号,用来渲染指定要素 |
| label | String | 标签,用来描述符号表示的值 |
classBreakInfos 对象中包括以下属性:
| Name | Type | Description |
|---|---|---|
| minValue | Number | 设置分段间隔的最小值 |
| maxValue | Number | 设置分段间隔的最大值 |
| symbol | Object | 符号,用来渲染分段间隔最小-最大值之间的要素 |
| label | String | 标签,用来描述符号表示的值 |
visualVariables对象中包括以下属性:
| Name | Type | Description |
|---|---|---|
| type | String | 专题图视觉变量类型,可选 "color、opacity" |
| field | String | 专题图视觉变量字段,用于和停靠点比较来确定绘制符号,只能为数字类型字段 |
| valueExpression | String | 专题图视觉变量计算表达式 |
| valueExpressionTitle | String | 专题图视觉变量计算表达式标题 |
| normalizationType | String | 专题图视觉变量归一化类型,"field、percent-of-total" |
| normalizationField | String | 专题图视觉变量归一化字段,将renderer中对应字段数据值除以归一化字段数据值 |
| normalizationTotal | Number | 专题图视觉变量归一化总和,将renderer中对应字段数据值除以给定值,若normalizationTotal未定义,则使用 字段属性值 / 字段属性值总和 进行归一化 |
| stops | Array | 专题图视觉变量颜色、透明度数组,定义在一系列停靠点中应用于要素的连续色带的颜色 |
stops中包括以下属性:
| Name | Type | Description |
|---|---|---|
| value | Number | 专题图视觉变量停靠点 |
| color | String | 专题图视觉变量停靠点颜色,根据相邻停靠点间的属性字段值和颜色进行线性插值 |
| label | String | 专题图视觉变量标签,用于生成图例 |
# enablePopup
- 类型:
Boolean - 非侦听属性
- 描述: 是否开启 popup 弹窗
# popupOptions
- 类型:
Object - 非侦听属性
- 描述: popup 弹窗时的配置参数,popupOptions 对象中 title 指弹窗的标题,展示 geojson 数据中的某一个字段属性,fields 展示列表,由传参者决定展示哪些字段值
- 格式:
eg:
popupOptions: {
title: "name",
fields: ["acroutes", "adcode"]
}
# enableTips
- 类型:
Boolean - 非侦听属性
- 描述: 是否开启 tooltip 弹窗
# tipsOptions
类型:
Object非侦听属性
描述: tooltip 弹窗时的配置参数,tipsOptions 对象中 title 指弹窗的标题,展示 geojson 数据中的某一个字段属性,fields 展示列表,由传参者决定展示哪些字段值
格式:
eg:
tipsOptions: {
title: "name",
fields: ["acroutes", "adcode"]
}
# customPopup
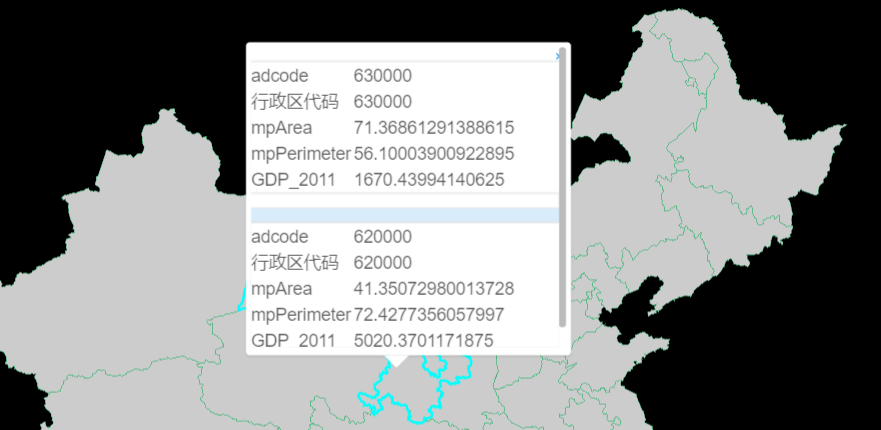
- 类型:
Function - 描述: JSX 风格的自定义 popup 样式内容, (features) => {}, features 为选中或者点击的样式
- 详情请看下面的示例
- 示例
<template>
  <mapgis-web-scene>
    <mapgis-geojson-layer v-bind="{ ...geojson }" />
  </mapgis-web-map>
</template>

<script>
export default {
  name: "custom-popup",
  props: {
    msg: String
  },
  watch: {
    center: function(next) {
      this.rightmap && this.rightmap.setCenter(next);
    }
  },
  data() {
    return {
      geojson: {
        baseUrl: `http://develop.smaryun.com/static/data/geojson/省会城市.geojson`,
        enablePopup: true,
        enableTips: true,
        layerStyle: new PointStyle({
          radius: 25000,
          color: "#ffff00",
          outlineColor: "#ff0000",
          outlineWidth: 2.5,
        }),
        highlightStyle: {
          point: new PointStyle({
            radius: 45000,
            color: "#ff0000",
            outlineColor: "#ffffff",
            outlineWidth: 2.5,
          }),
          line: new LineStyle({
            width: 6,
            color: "#000000",
            shadow: new Shadow({ blur: 6, color: "#ff0000" }),
            outlineColor: "#ff0000",
            outlineWidth: 8,
          }),
          polygon: new FillStyle({ color: "#ff0000", opacity: 0.7 }),
        },
        customPopup: (features) => (
          <mapgis-ui-list class="jsx-custom-popup" item-layout="horizontal">
            {features.map((feature) => {
              return (
                <mapgis-ui-list-item>
                  <mapgis-ui-div
                    title={feature.title}
                    style={{ width: "100%" }}
                  >
                    {Object.keys(feature.properties).map((p) => {
                      return (
                        <mapgis-ui-row>
                          <mapgis-ui-col span={8}>{p}</mapgis-ui-col>
                          <mapgis-ui-col span={16}>
                            {feature.properties[p]}
                          </mapgis-ui-col>
                        </mapgis-ui-row>
                      );
                    })}
                  </mapgis-ui-div>
                </mapgis-ui-list-item>
              );
            })}
          </mapgis-ui-list>
        ),
        customTips: features => {
          if (features.length <= 0) {
            return <div class="custom-tips">未选中</div>;
          } else {
            return (
              <mapgis-ui-div class="custom-tips" title={features[0]}>
                {Object.keys(features[0].properties).map(p => {
                  return (
                    <mapgis-ui-row>
                      <mapgis-ui-col span={8}>{p}</mapgis-ui-col>
                      <mapgis-ui-col span={16}>
                        {features[0].properties[p]}
                      </mapgis-ui-col>
                    </mapgis-ui-row>
                  );
                })}
              </mapgis-ui-div>
            );
          }
        }
      }
    };
  },
  methods: {
    handleRightMap(e) {
      console.log("e", e);
      this.rightmap = e.map;
    }
  }
};
</script>

<style>
.map {
  height: 100vh;
  width: 100vw;
}
.custom-popup {
  position: absolute;
  z-index: 2000;
  height: 240px;
  overflow-y: scroll;
}
</style>
# customTips
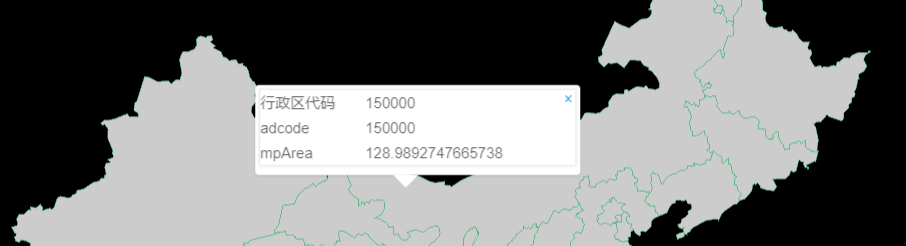
- 类型:
Function - 描述: JSX 风格的自定义 tips 样式内容, (features) => {}, features 为选中或者点击的样式
- 详情请看下面的示例
- 示例
<template>
  <mapgis-web-scene>
    <mapgis-geojson-layer v-bind="{ ...geojson }" />
  </mapgis-web-map>
</template>

<script>
export default {
  name: "custom-popup",
  props: {
    msg: String
  },
  watch: {
    center: function(next) {
      this.rightmap && this.rightmap.setCenter(next);
    }
  },
  data() {
    return {
      geojson: {
        baseUrl: `http://develop.smaryun.com/static/data/geojson/省会城市.geojson`,
        enablePopup: true,
        enableTips: true,
        layerStyle: new PointStyle({
          radius: 25000,
          color: "#ffff00",
          outlineColor: "#ff0000",
          outlineWidth: 2.5,
        }),
        highlightStyle: {
          point: new PointStyle({
            radius: 45000,
            color: "#ff0000",
            outlineColor: "#ffffff",
            outlineWidth: 2.5,
          }),
          line: new LineStyle({
            width: 6,
            color: "#000000",
            shadow: new Shadow({ blur: 6, color: "#ff0000" }),
            outlineColor: "#ff0000",
            outlineWidth: 8,
          }),
          polygon: new FillStyle({ color: "#ff0000", opacity: 0.7 }),
        },
        customPopup: (features) => (
          <mapgis-ui-list class="jsx-custom-popup" item-layout="horizontal">
            {features.map((feature) => {
              return (
                <mapgis-ui-list-item>
                  <mapgis-ui-div
                    title={feature.title}
                    style={{ width: "100%" }}
                  >
                    {Object.keys(feature.properties).map((p) => {
                      return (
                        <mapgis-ui-row>
                          <mapgis-ui-col span={8}>{p}</mapgis-ui-col>
                          <mapgis-ui-col span={16}>
                            {feature.properties[p]}
                          </mapgis-ui-col>
                        </mapgis-ui-row>
                      );
                    })}
                  </mapgis-ui-div>
                </mapgis-ui-list-item>
              );
            })}
          </mapgis-ui-list>
        ),
        customTips: features => {
          if (features.length <= 0) {
            return <div class="custom-tips">未选中</div>;
          } else {
            return (
              <mapgis-ui-div class="custom-tips" title={features[0]}>
                {Object.keys(features[0].properties).map(p => {
                  return (
                    <mapgis-ui-row>
                      <mapgis-ui-col span={8}>{p}</mapgis-ui-col>
                      <mapgis-ui-col span={16}>
                        {features[0].properties[p]}
                      </mapgis-ui-col>
                    </mapgis-ui-row>
                  );
                })}
              </mapgis-ui-div>
            );
          }
        }
      }
    };
  },
  methods: {
    handleRightMap(e) {
      console.log("e", e);
      this.rightmap = e.map;
    }
  }
};
</script>

<style>
.map {
  height: 100vh;
  width: 100vw;
}
.custom-popup {
  position: absolute;
  z-index: 2000;
  height: 240px;
  overflow-y: scroll;
}
</style>
# 事件
# load
事件载荷包含以下部分:
component组件自身 this 引用
# bbox
计算 bbox,发生在 load 事件之后 事件载荷包含以下部分:
bbox数据对应的空间范围 [minx,miny,maxx,maxy]
# 示例
# 绘制区要素 建筑物 分段专题图
<template>
  <mapgis-web-scene>
    <mapgis-3d-geojson-layer
      :baseUrl="baseUrl"
      :autoReset="autoReset"
      :renderer="renderer"
    >
    </mapgis-3d-igs-feature-layer>
  </mapgis-web-scene>
</template>

<script>
export default {
  data() {
    return {
      baseUrl: "http://localhost:8895/geojson/buildings.json",
      autoReset: true,
      renderer: new ClassBreaksRenderer({
        type: "class-breaks",
        field: "mpPerimete",
        defaultSymbol: new PolygonSymbol3D({
          type: 'polygon-3d',
          symbolLayers: new ExtrudeSymbol3DLayer({
            type: "extrude",
            material: { color: "#ff0000", },
            sizeField: "AREA",
            sizeRatio: 10,
          })
        }),
        defaultLabel: "其他",
        classBreakInfos: [
          {
            maxValue: 0.004,
            minValue: 0,
            symbol: new PolygonSymbol3D({
              type: 'polygon-3d',
              symbolLayers: new ExtrudeSymbol3DLayer({
                type: "extrude",
                material: { color: "#00ff00", },
                sizeField: "AREA",
                sizeRatio: 10,
              })
            }),
          },
          {
            maxValue: 0.006,
            minValue: 0.004,
            symbol: new PolygonSymbol3D({
              type: 'polygon-3d',
              symbolLayers: new ExtrudeSymbol3DLayer({
                type: "extrude",
                material: { color: "#0000ff", },
                sizeField: "AREA",
                sizeRatio: 100,
              })
            }),
          },
        ],
      }),
    };
  },
};
</script>